We are big fans of quantitative investing strategies since it helps take human emotion out of the equation. While it’s relatively easy to build investment strategies based on numerical criteria such as valuation or growth rates, it’s harder when it comes to more subjective things like whether or not a company operates in a highly competitive industry. In theory, companies that operate in consolidated industries with little competition should have stable or increasing profit margins, earn higher returns on capital and thus generate higher stock price returns than companies that operate in intensely competitive industries.
While hard numbers on market share can sometimes be available, the data is often messy, incomplete, comes from a variety of sources, and is often based on estimates. We wanted to experiment with an alternate approach. Is there any useful information in companies’ SEC filings? Is the language about competition just boilerplate or are there subtle differences we can use to help categorize companies?
We decided to explore what (if any) relationship there is between stock price returns and the language companies use describing competition. We choose to look at FY2015 or FY2016 (whatever was filed closest to 1/1/2016) 10-K filings and their relationship to stock price returns from 1/1/2016 until 11/01/2019.
Designing the Experiment
We built two simple bag-of-words (e.g. treating a document as just a collection of words or word pairs) models using the Apache OpenNLP toolkit to parse the text in each company’s 10-K filing. The first model was a unigram model that counted occurrences of six keywords (competition, compete, competitive, competitors, competitor, competitiveness). The second was a bigram model that counted the occurrences of two-word phrases that signified strong competition. We looked for 28 key phrases such as “fierce competition,” “intense competition,” etc.
When doing exploratory analysis, the biggest thing we noticed is the occurrence of “competition” keywords varied by sector. Services businesses, particularly in the technology industry, made frequent use of competition keywords. In comparison, other industries, like the automotive industry, despite being highly competitive, made proportionally less mentions of competition.
We also noticed differences between small and large companies. A large conglomerate with multiple divisions would explain the competitive dynamics for each division, thus mentioning keywords more than a small company with only one division.
Building the Models
To deal with these two issues we limited our sample to companies operating in a single sector and looked at the number of keywords (or phrases) found in proportion to the amount of words or two-word pairs in the 10-K rather than a simple total occurrence count.
We choose to first look at just the industrial and manufacturing sector. We made a few changes to the official classifications to improve the quality of the dataset. We included auto manufacturers and auto parts companies that had found their way into the consumer discretionary sector. We also excluded services businesses such as Verisk (VRSK), Equifax (EFX), Nielsen (NLSN) and staffing companies Manpower (MAN) and Robert Half (RHI) that were classified as industrial companies. Our final sample set was 105 large and midcap industrial companies.
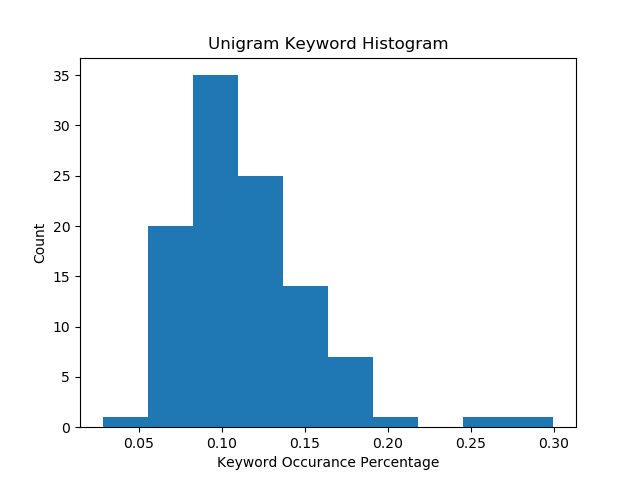
Looking at the unigram (single keyword) model, we see an interesting distribution. There is something that maybe resembles a normal distribution centered around .1% but then we have a group of extreme outliers at .25-.3%.
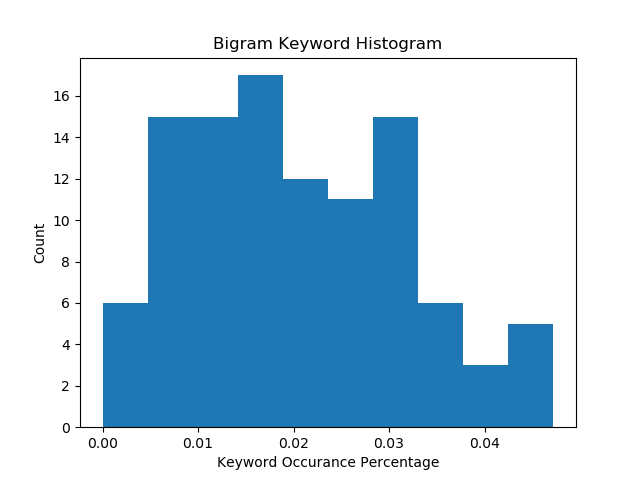
The distribution of key phrase occurrences for the bigram (pair of keywords) model looks slightly different. There is a big chunk of companies between the .01% and .03% marks and then trailing off to the .04-.05% marks.
And yes, there was one company that didn’t have a match on any of our 28 key phrases. That company was General Dynamics (GD). This makes some sense since many of the company’s major programs and business units such as the M1 Abrams tank and Electric Boat division face no to very little competition. However, its Gulfstream civil aviation division does face competition; however, it doesn’t appear management viewed any potential competitive threats as worthy of the language we were screening for.
Next, we looked at box plots of return quartiles versus keyword occurrences to identify any outliers and patterns in the data. First up are the bigram keywords.
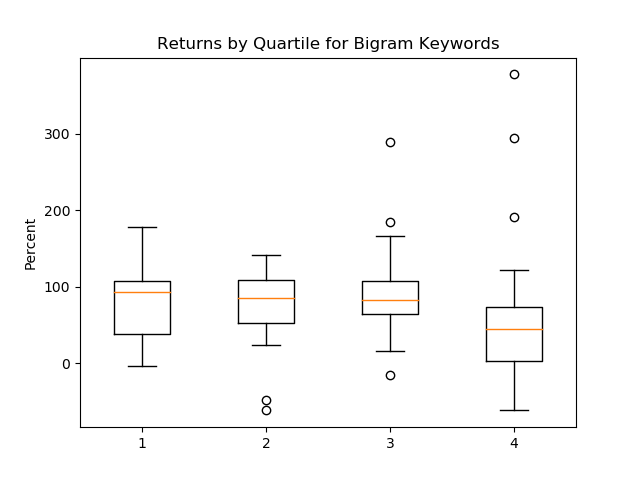
Looking at the outliers, GE is the one with the greatest negative return in the second quartile. Our competitive analysis most likely did a good job here. Two of GE’s main businesses, locomotives and jet engines, are heavily consolidated with low levels of competition. GE’s low terrible stock performance is more due to financial issues from previous management eras and overpayment (coupled with poor performance) of its energy division.
The second outlier in the second quartile is GT. We don’t follow GT closely but the main culprit for poor performance seems to be a combination of tariffs on tires along with the slowdown in the automotive industry. As a commodity tire manufacturer, we would have expected our algorithm to place GT in the third or fourth quartile along with other auto parts and automotive manufacturers.
When we get to the third and fourth quartiles, the big outliers are now extreme winners rather than extreme losers. In the third quartile, we have two extreme winners, TDY with a 289% return and CTAS with a 184% return. With CTAS, it’s possible to argue that it’s more of a services company (uniform rental and services) versus an industrial company.
In the fourth quartile we have MSA with a 190% gain, MRCY with a 294% gain, and CPRT with a 377% gain. MRCY and TDY are both primarily defense contractors but ended up being grouped in the third and fourth quartile versus the rest of the defense contractors that ended up in the first and second quartile. CPRT just appears to be a big winner in a competitive (although consolidating) industry.
Based on just initial exploratory analysis, it’s clear our simple algorithm has some issues and needs refining in order to draw stronger, more robust conclusions from the data.
Making Improvements
So, what could we do to improve the model?
First, we could switch from using a bag-of-words model to using a more sophisticated sentence or sentiment-based analysis. For example, in LUV’s 2015 10-K we find the phrase “Competition within the airline industry is intense and highly unpredictable.” Despite any English reader being able to easily identify that this sentence is saying competition is intense, our bigram model would not pick up on this because the word competition is located far away from the words “intense.” In fact, this is a major problem with text analysis of the English language. Adjectives are frequently located far away from the words they modify.
Second, we can explore lengthening the stock return timeline. We looked at a period of time just shy of 4 years. Over short periods of time, stock returns can and usually are driven more by emotions or trading activity than fundamentals. Short-term returns may be driven by transient fears (e.g., the 2017 wipeout in auto parts retailers over fears of competition from Amazon (NASDAQ:AMZN) combined with slowing sales due to back-to-back mild winters). Valuation levels can also play a significant role in driving short- and medium-term returns. Indeed, we’ve seen research showing investors would need a timeline of at least a decade if they wanted to invest based solely on the economic characteristics of a business and ignore valuations.
Third, we can switch from trying to predict stock prices to instead predicting changes in company fundamentals. We would expect companies in more competitive businesses to have lower and perhaps deteriorating profit margins and poor returns on capital. Companies in less competitive industries should have higher and increasing margins and higher returns on capital. This would help eliminate the emotional component that’s found in using stock price performance as a gauge.
Fourth, we can examine changes in the usage of competition keywords (or even better changes in sentiment) from year to year. This should help deal with the fact that different companies, even those operating in the same industry, use different language when discussing competition. This may even allow us to begin to compare companies operating in different industries.
Finally, as we saw from our boxplots, we have issues with outliers. This really shouldn’t be surprising, since in general the returns of the overall stock market are driven by a small group of extreme winners. We may want to frame the results of our analysis slightly differently. Instead of expecting a smooth linear relationship, we may want to adjust our expectations. Instead, we may try classifying companies in one of two groups. In one group, you would place the companies that face substantial competition and view it as a basket where investors face long odds of selecting stocks that may do well. The other group we might define as stocks where investors face better odds of finding successful investments.